Demand Forecasting Failure Patterns in UK Mid-Market CPG: The 4 Modes That Break Most Excel Models (2026)
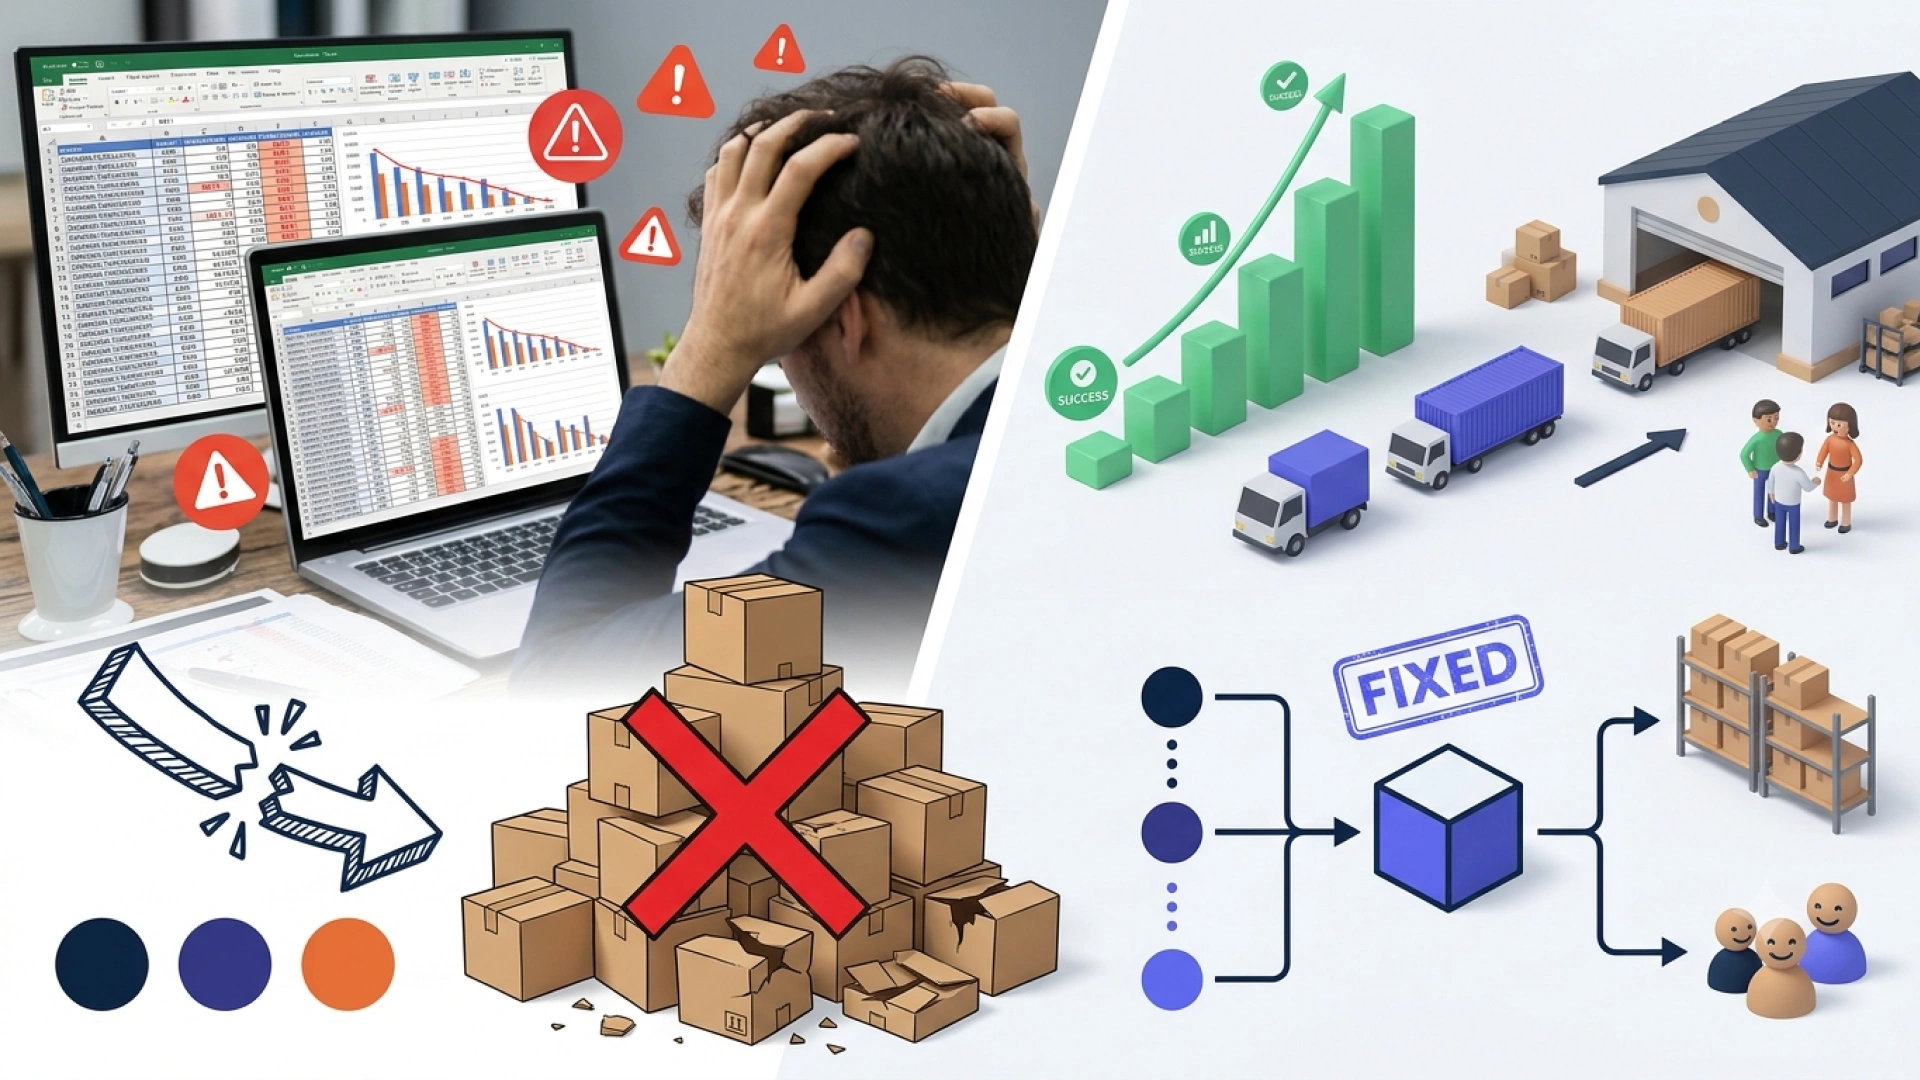
Demand forecasting fails the same way in UK mid-market food and drink businesses. Not on the data quality, the planner skill, or the system choice, but on four specific failure patterns the model was never built to handle. Each one is fixable in around 60 days with bounded scope, without a platform change.
What are the most common demand forecasting failure modes in UK food and drink?
The four failure modes that consistently break mid-market demand forecasting are new product launches with no usable baseline, promotional uplifts modelled on averages, seasonal peaks treated as linear trends, and manual exceptions that consume the whole process. Each is predictable. None requires a new system to fix.
Failure mode 1: New product launches with no usable baseline
When a new SKU is launched into a major UK grocery account, the planning team typically goes looking for an anchor and finds either nothing usable or an analogue product from years ago that shared two or three characteristics with the new line. The range extension gets a best-guess uplift applied to an existing item. The promotional volume gets manually adjusted based on commercial team intuition.
What this looks like inside the business: enormous cognitive load on one or two senior planners. The planner knows the business intuitively, but that knowledge does not survive a holiday, a resignation, or a board request to explain the methodology. The forecast is accurate when that person is accurate, and breaks when they guess wrong. This is not a forecasting problem. It is a dependency problem.
Failure mode 2: Promotional uplifts modelled on averages
The promotional uplift model in most UK mid-market businesses is a blended average of past promotions, adjusted manually by whoever remembers the exceptions. The problem: promotional uplifts are not average events. They are driven by mechanic, retailer, season, price point, and competitive context, none of which average out cleanly. This is the operational layer underneath the strategic Revenue Growth Management lever, and the slice that most often fails first.
When a 3-for-2 in Q4 performs differently from a 3-for-2 in Q2, the planner notes it but the model does not learn it. The next time a similar promotion runs, the same average gets applied with a gut-feel adjustment. Case fill rate takes the hit. The commercial team blames supply chain. Supply chain points at the forecast. Nobody is wrong, but the process is.
Failure mode 3: Seasonal peaks treated as linear trends
Seasonal demand is not a straight line. It is a curve with an inflection point, and that inflection point moves year on year based on retailer ranging windows, promotional calendars, and external factors the model has never seen before. Most Excel-based forecasts apply a seasonal index built from two or three prior years, then layer a growth trend on top. When the season arrives early, when the retailer forward-buys, or when a competitor goes out of stock and unexpected volume comes in, the model has no mechanism to adjust.
The consequence: six weeks of finished goods carried into a category review because the seasonal ramp was modelled two weeks late. The working capital cost is real. The range review conversation is uncomfortable. The root cause is often a seasonal index that has not been updated since before a major account restructure.
Failure mode 4: Manual exceptions that consume the whole process
This is the failure mode most businesses do not talk about. The formal forecast model exists, but the actual number that goes into production planning gets adjusted manually by email, by phone call, by a note in a shared spreadsheet that twelve people have access to. The exception handling process becomes the process.
When exception volume is low, this works. When a promotional period runs simultaneously with a seasonal peak and two new product launches, the exception queue backs up, decisions get made on incomplete information, and the number in the system is whatever the last person to touch the file entered. This is where AI has an immediate role, not in replacing the model, but in managing the exception queue with enough intelligence to surface the decisions that genuinely need human judgement.
How do these failure modes show up on the P&L?
Demand forecasting failures do not stay in supply chain. They surface as margin per SKU erosion, excess inventory write-offs, expedited freight costs, retailer deductions for short shipments, and lost promotional ROI from volume that was never in the plan.
| Failure mode | Where it shows on P&L | Typical trigger |
|---|---|---|
| No baseline for NPD | Overstock or lost sales at launch | Major account listing with no analogue |
| Promotional average modelling | Short shipments, deductions, lost uplift | High-mechanic or high-value promotion |
| Linear seasonal index | Excess stock into range review | Retailer calendar shift or early peak |
| Manual exception overload | Wrong number in production plan | Peak period, multiple concurrent events |
None of these are visible as a single line item. They sit inside case fill rate, trade spend variance, freight cost, and shrinkage. Which is exactly why they are tolerated: the cost is real but diffuse, and the cause is not obvious unless somebody is looking for it specifically.
Why does bounded scope matter?
The most common reason AI demand forecasting projects stall in UK food and drink is not technical. It is that the scope was wrong from the start.
A typical pattern: a business decides to fix forecasting. The project gets defined as an 'AI demand forecasting overhaul'. A vendor is engaged. The data requirements are larger than expected. The ERP integration takes longer than scoped. The commercial team has different requirements from supply chain. Twelve months later, the pilot is still running. The root cause is usually the data engineering bottleneck, not the model itself.
The alternative, and what AI Navi has seen actually work across five UK food and drink businesses, is choosing one of the four failure modes, defining the problem in terms of a specific SKU cluster or account group, and building something narrow enough to ship in weeks rather than months.
The question is not 'can we fix forecasting?' The question is: which specific failure mode is costing the business the most right now, and what is the smallest intervention that addresses it?
AI Navi Insight: from the FlightCheck files
Across UK mid-market CPG operations AI Navi has assessed, manual S&OP corrections cost an average of 12% forecasting accuracy. This is not a technology gap. It is a process gap created by the four failure modes above, in combination. Reference case: a £400M UK CPG operator presented with a Flight Risk Index of 7.2, indicating high programme risk, multiple competing priorities, and no clear ownership of AI outcomes. The bounded scope agreed was not 'fix demand forecasting'. It was a single data pipeline project: connecting trade spend actuals to the demand signal in near real-time, so the promotional uplift model was working from actual in-market performance rather than a three-week-old extract. Inside 60 days, the Flight Risk Index moved from 7.2 to 4.1. The forecasting model itself was not rebuilt. The data latency that was making every promotional forecast a guess was removed. The planning team kept decision-making authority, with better information, faster, and without the manual extraction that had been eating two days per planning cycle. Downstream effects on case fill rate, trade spend variance, and the quality of S&OP conversations followed. None were promised upfront. They were the consequence of fixing one specific, well-defined problem. |
How do you know which failure mode to fix first?
Start where the pain is loudest, not where the technology is most interesting. A quick diagnostic for UK food and drink COOs and Supply Chain VPs:
- Promotional periods: does case fill rate drop consistently during promotional windows? Failure mode 2 is the cost driver.
- New product launches: do NPD forecasts require significant manual override in the first three months? Failure mode 1 is the bottleneck.
- Seasonal peaks: does the business carry excess stock into category reviews or miss seasonal uplifts by more than one week? Failure mode 3 needs attention.
- Exception volume: do more than 20% of SKUs require manual adjustment to the forecast each week? Failure mode 4 is consuming both planner time and accuracy.
Most UK mid-market food and drink businesses have more than one. The right starting point is whichever has the clearest link to a number the board is already watching: case fill rate, trade spend ROI, or working capital tied up in finished goods.
The reason to start narrow is not timidity. A working solution to one specific problem builds the internal credibility to tackle the next one, and the financial impact gives the AI ROI conversation with the board a concrete anchor. A stalled forecasting programme builds nothing except scepticism.
What is a realistic timeline to fix one failure mode?
Based on AI Navi's work inside five UK food and drink businesses, a realistic 60-day fix for a single failure mode, working with existing data and systems, looks like this:
- Weeks 1 to 2: diagnose the specific failure point. Map the data inputs, identify the latency or gap, quantify the cost.
- Weeks 3 to 6: build the intervention. Typically a data pipeline, a structured input layer, or an exception triage model, not a platform change.
- Weeks 7 to 8: run in parallel with the existing process. Measure variance between old output and new output.
- Weeks 9 to 10: hand over to the planning team with documented logic and a working dashboard. The planner stays in control. The model removes the manual work.
This is a bounded fix that delivers a measurable result in a timeframe the board can see. The broader programme comes later, once the team trusts the output.
Next step
If a demand forecasting issue has been on the agenda for two S&OP cycles without a clear fix, the right next move is to map which of the four failure modes is driving the cost. The AI FlightCheck is structured to start this conversation: a fixed-scope two- to four-week assessment that identifies the specific failure points and produces a 90-day action plan. Comparable diagnostics in the market typically price at $5,000 to $10,000.
For a faster self-assessment first, take the AI Readiness Scorecard. For sustained ownership of the cross-functional accountability across supply chain, commercial, and finance, a fractional Chief AI Officer is structured to carry it for the duration of the build.
Frequently asked questions
Why do most UK CPG demand forecasts fail?
Because the model was not built for the moments that drive most of the variance. Steady-state demand forecasts adequately in Excel. The failures cluster at NPD launches, promotions, seasonal peaks, and exception-heavy periods, which is exactly when the forecast matters most to the P&L.
Can AI fix demand forecasting in 60 days?
AI can fix one specific failure mode in around 60 days when the scope is bounded to a single SKU cluster, account group, or process step. Broader forecasting redesigns typically take longer because the constraint is rarely the model. It is the data foundation and the cross-functional ownership.
Do we need to replace the existing forecasting system?
Usually not. Most UK mid-market food and drink businesses have adequate forecasting systems and inadequate data flowing into them. Replacing the system without fixing the underlying data flow tends to reproduce the same failure modes inside a more expensive interface.
What is manual S&OP correction actually costing?
On average, 12% forecasting accuracy across the UK mid-market CPG businesses AI Navi has assessed. The cost surfaces in case fill rate, expedited freight, and excess stock at category review, not as a single line item.
Who should own a demand forecasting fix?
A named senior owner with sign-off authority across supply chain, commercial, and finance. Where this is missing, the fix tends to stall regardless of the technology choice. A fractional Chief AI Officer is structured to carry the cross-functional accountability for the duration of the build.
Is this a use case for a fractional CAIO or a consultancy?
A fractional CAIO owns the outcome and ships the working solution. A traditional consultancy delivers analysis and recommendations. For a bounded 60-day failure-mode fix, the fractional model is faster and the ownership is clearer.